



I’m going to start with a warning/preface: I understand that analytics to most is boring, but it’s a subject that fascinates me and I’ve been tracking daily for YEARS. I also understand that this may be a little confusing to some, “in the weeds” and is a minuscule problem in the grand scheme of a world of BIG problems.
I’ve noticed something I wanted to share and ask if anyone else has seen it, and what Substack can do to address it. I am being fully transparent in sharing my own personal statistics here, more than I’ve seen most share of their own results, in an effort to shed light on this issue.
I also need your help in sharing this on Substack and across social media, so more people see it.
I don’t believe that Substack is doing anything nefarious, or intentionally manipulating the system in any way. I think it’s more likely others are exploiting gaps in their reporting capabilities, or that Substack hasn’t taken the time to properly address analytics holistically as they’ve added new features & methods of engagement to the platform for creators to connect with their audiences.
Question 1: What is the best way to properly measure the effectiveness of a post, or of a note, or of a livestream, or a video podcast, and showcase that all in one, easy-to-understand, connected dashboard?
I think it’s a combination of
email opens
website/app “views”
click throughs
likes, comments
watch time
downloads
new/lost subscribers
new follows
shares/restacks, both on and off Substack
Maybe Substack could, like Google Analytics used to, show the paths people took and map out their various journeys through the content & related links. It would help creators to better visually understand how people spend their time engaging with their work.
Why The “Ramp Up” Of View Count After a Week’s Vacation?
There is definitely a nuance to Substack view counts for my IndieMediaToday publication. After more than 2300 published posts in 5+ years to this newsletter, I’ve noticed that, when I take a week off from publishing the usual 1-2 posts per day, like I did last week, the dropoff in “views” is substantial, and it takes days to “ramp back up” to the typical daily view count after getting back to the schedule.
That is weird.
Question 2: When 95% of the traffic is counted from “email opens” - why would it require a multi-day “ramp up” period to get back to “normal” view counts?
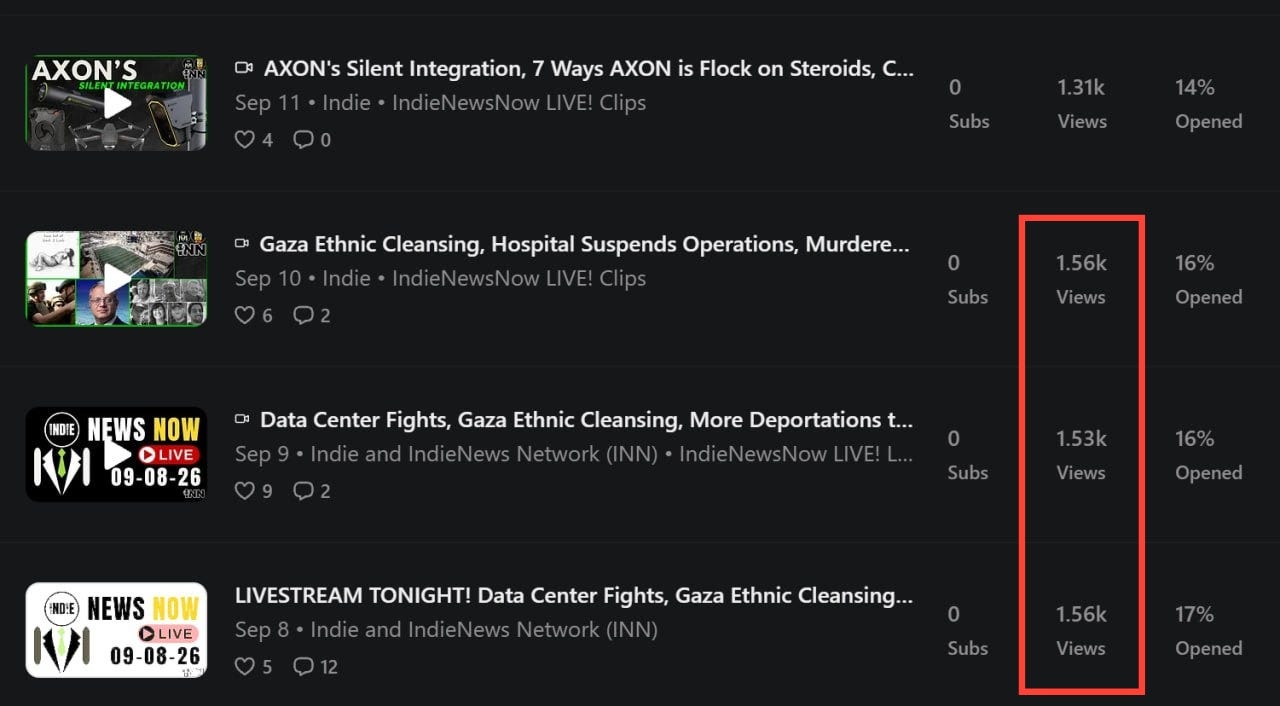
Below is a screen cap taken at midnight on September 12, 2026 from my creator dashboard, showing high-level results from the 4 posts published since coming back from a week off. Notice that the “views” are all about the same for each post - between 1530 and 1560 views each. That refers to the view of the post itself, not views of the video itself - that’s a separate view count that you need to click into the post analytics to see.
When I click on the Analytics tab in the dashboard and click the “Traffic” tab at the top, then filter down to those specific same days, the “Total Traffic” stats show a slightly different picture:
Sept 8: 1744 views
Sept 9: 1867 views
Sept 10: 2015 views
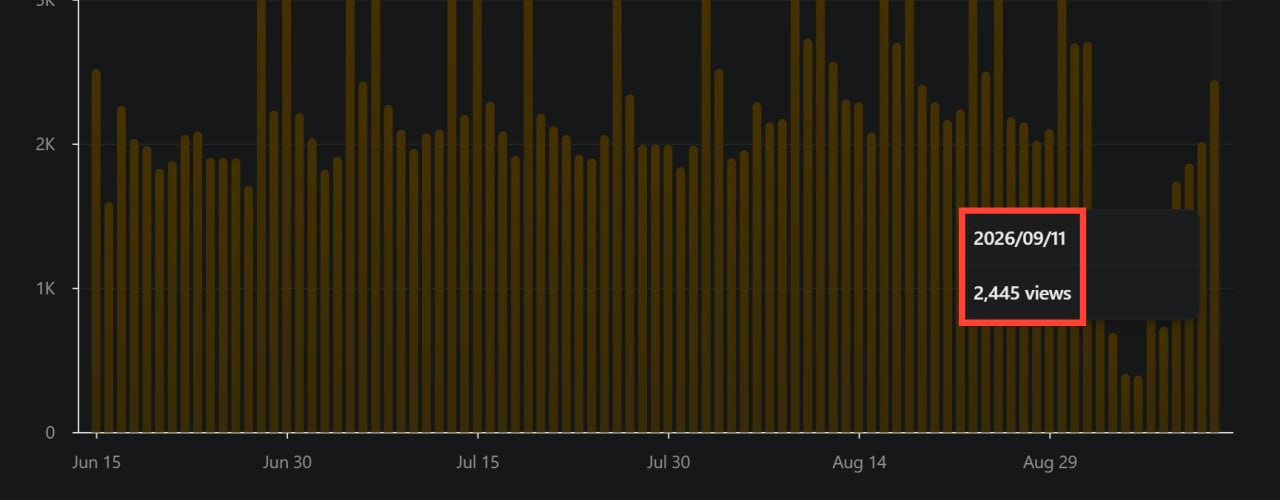
Sept 11: 2445 views
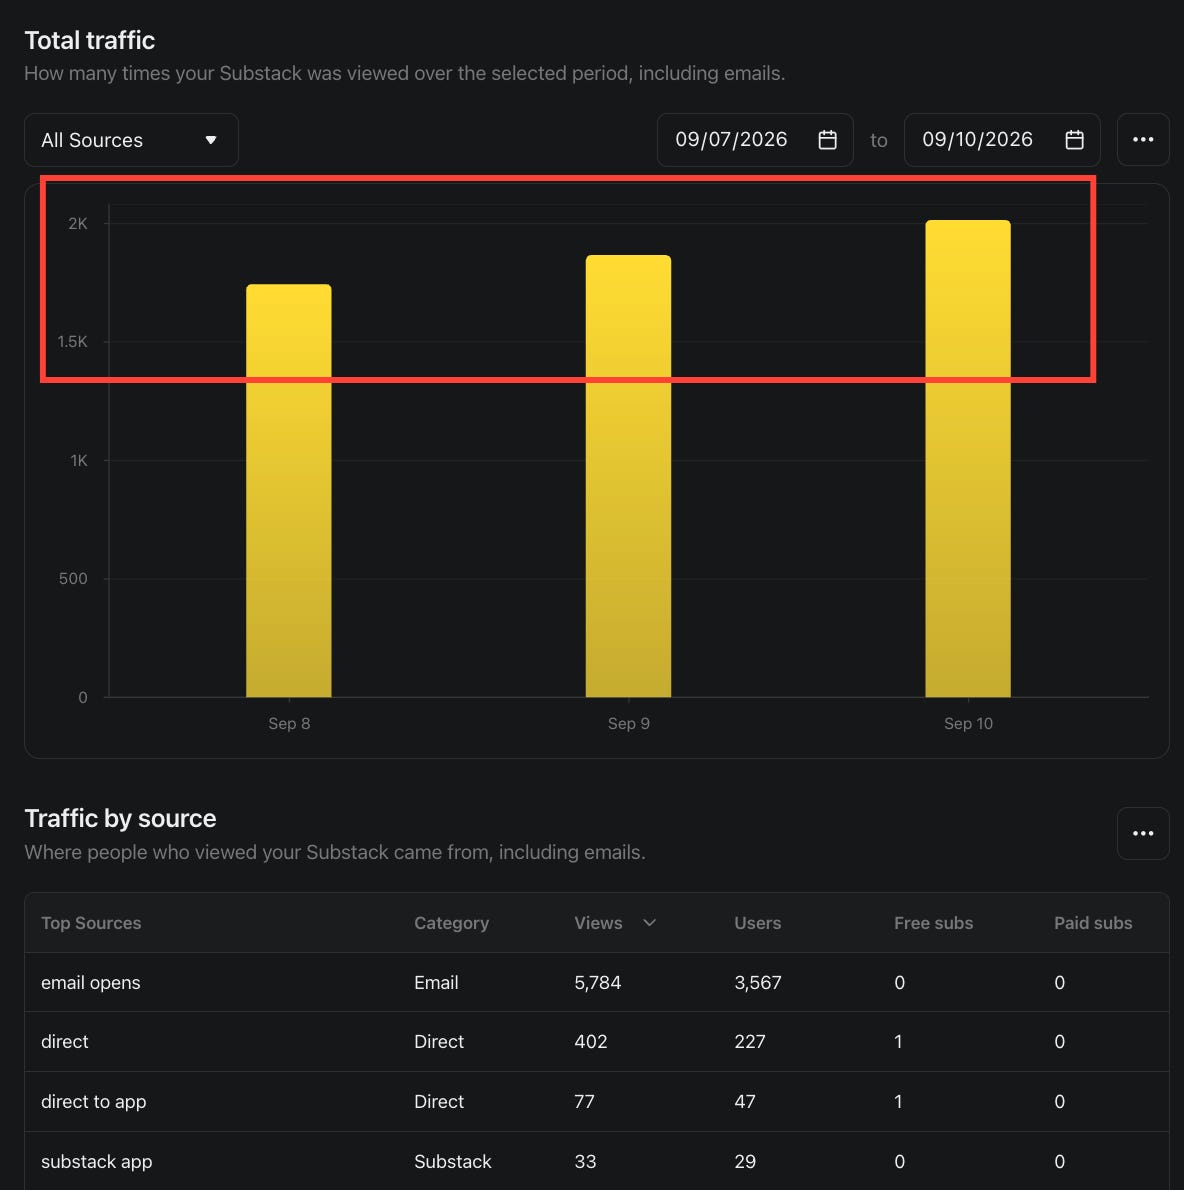
My behavior was no different over those 3 days than Tuesday-Wednesday-Thursdays most weeks. There really is no reason there should be this “ramp up” happening over 3 days.
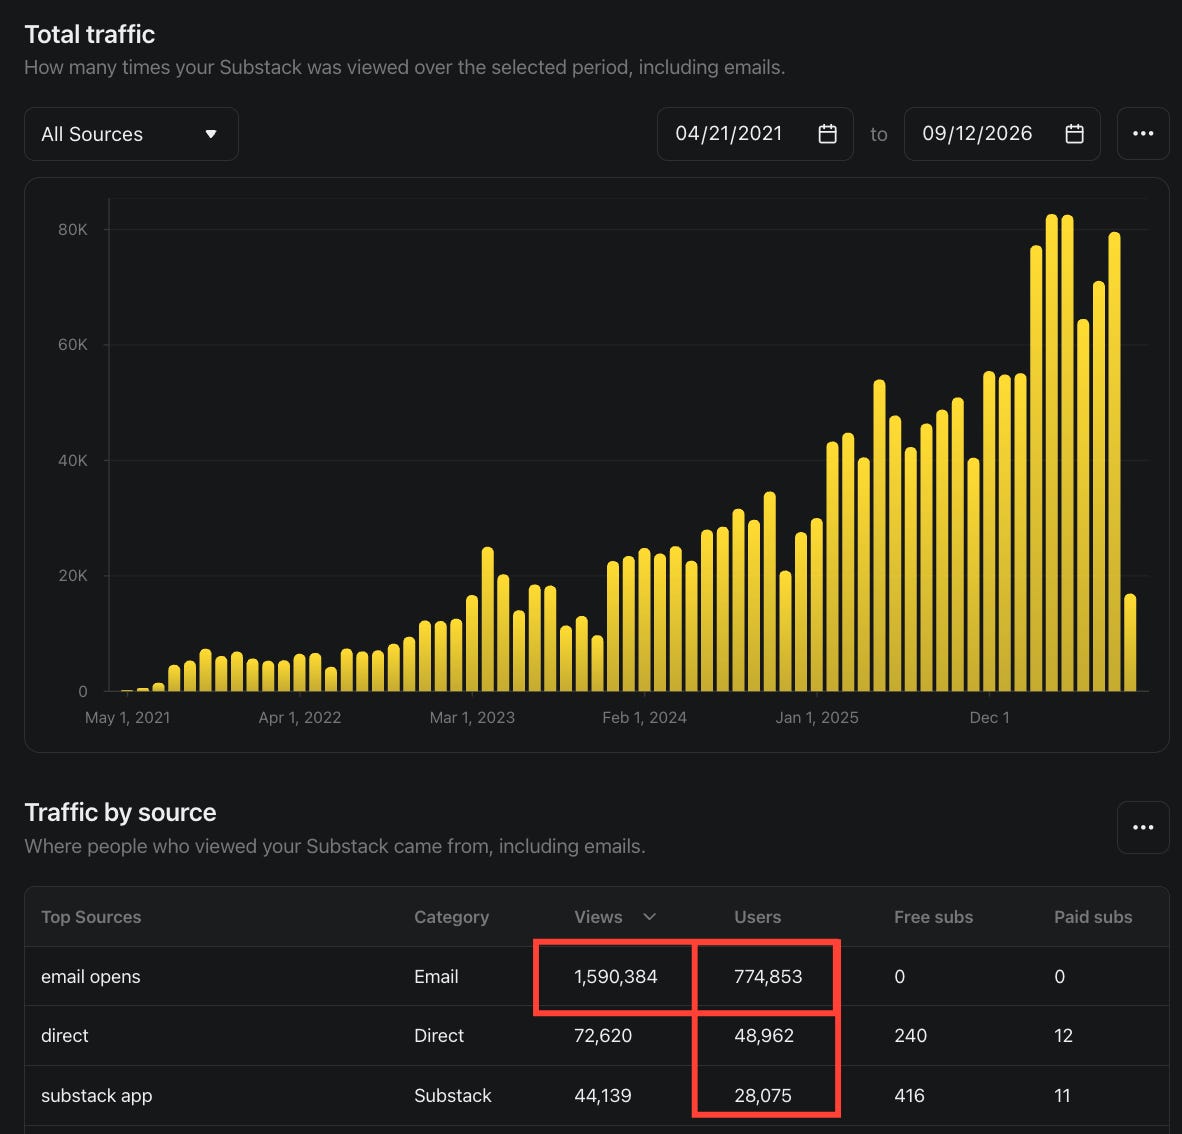
Historically, I have been publishing to this newsletter daily for 5+ years - here is the chart of the all-time View count, broken down by month. Almost every time you see a big dip (each November - 2023, 2024 & 2025), I took a week off.
Question 3: What does 774,853 USERS in the graphic below over the past 5 years MEAN? That 3/4 of a MILLION unique people saw my content?
Hard to believe, but I’ll take it, I guess.
I am incredibly grateful for the people who do go out of their way to like, comment, share & contribute. I do not take that for granted at all. I just wish it translated to more regular, consistent engagement (and more paid subscriptions).
The September 11, 2026 View Count and the “Extra” 1100 Views
I want to look specifically at the analytics from September 11 “view” count of 2445 views, as of midnight (as showcased in the first chart at the top of the article). This is the thing that bothered me the most. I only sent out one email/post at 8:30am ET - just like the previous 3 days. Below are the high-level analytics for the Friday morning post to IndieMediaToday.
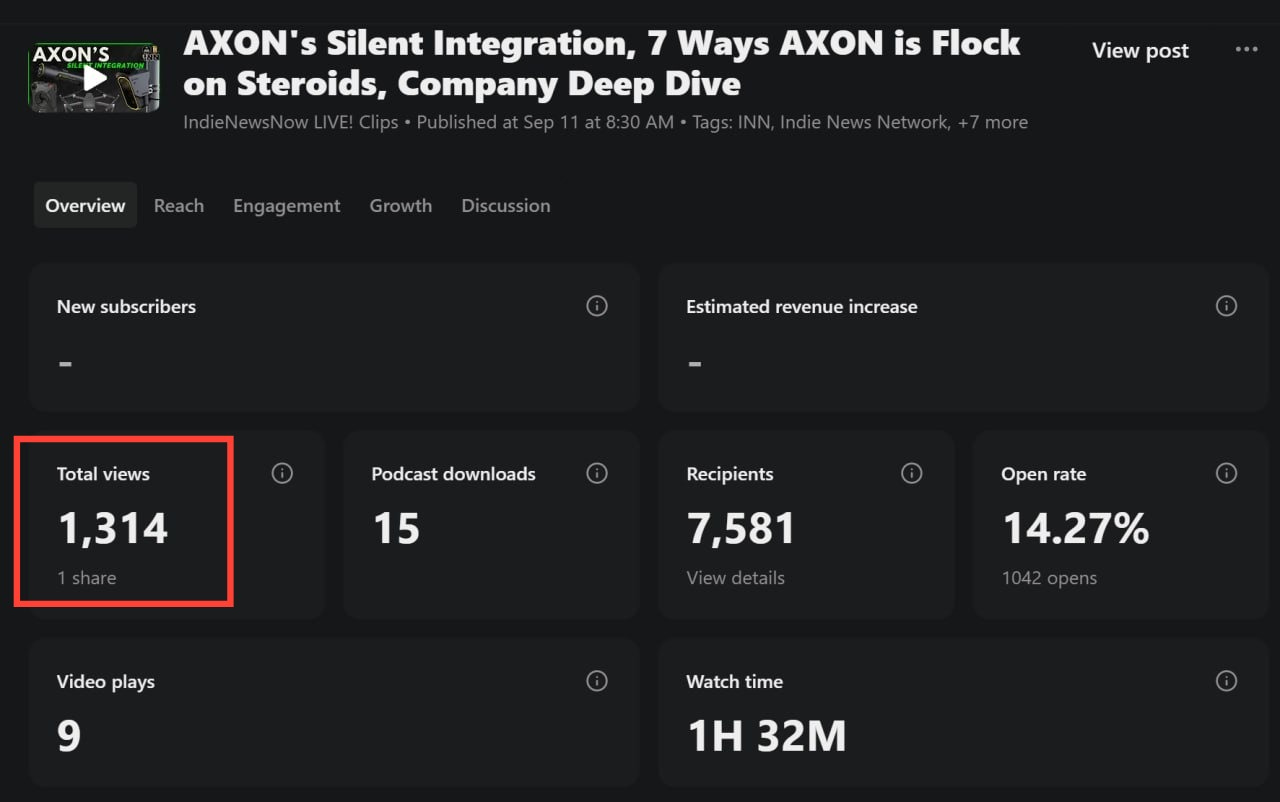
Notice that the total “view count” for the day, as of 15 1/2 hours after posting, was 1314 - but the total “views” for the day in the Traffic section of the Stats on the Dashboard clocked in at 2445 views. What contributed to those 2445 views?
Question 4: Where did the other 1131 views come from? (2445-1314)
In looking at everything published across Substack that day, I noticed that I am tagged as a co-author in two other articles published to another newsletter - INNnewsletter. There was a video post published at 8am ET, and another text-image based post published at 5:45pm ET. My personal Substack account (Indie) is tagged in both of those, but even if you add those “view” counts - which should not count there, BTW - that would only add another 670, still leaving us 430 views that day unaccounted for. Where are they coming from?
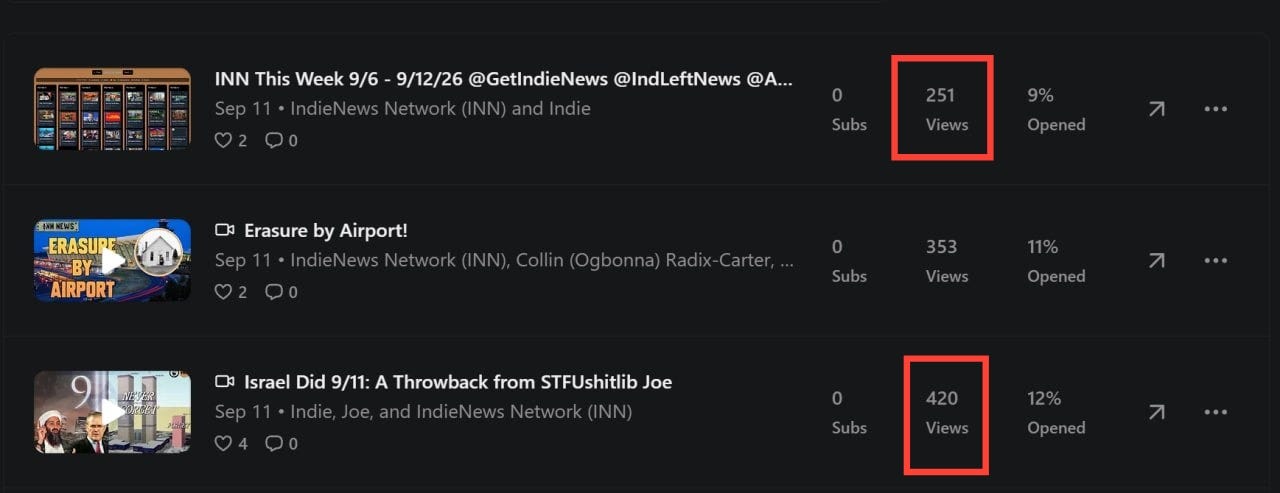
Question 5: Does the Publication “Views” count views from other newsletters that the authors are tagged in, or are the views specific to that publication?
Questions About How Podcast Download Metrics Are Calculated and Displayed
Then there’s the curious case of the “Podcast Download” count, which is somehow a completely different & separate metric than the post view count on a video podcast post. The weakness of those statistics is particularly frustrating.
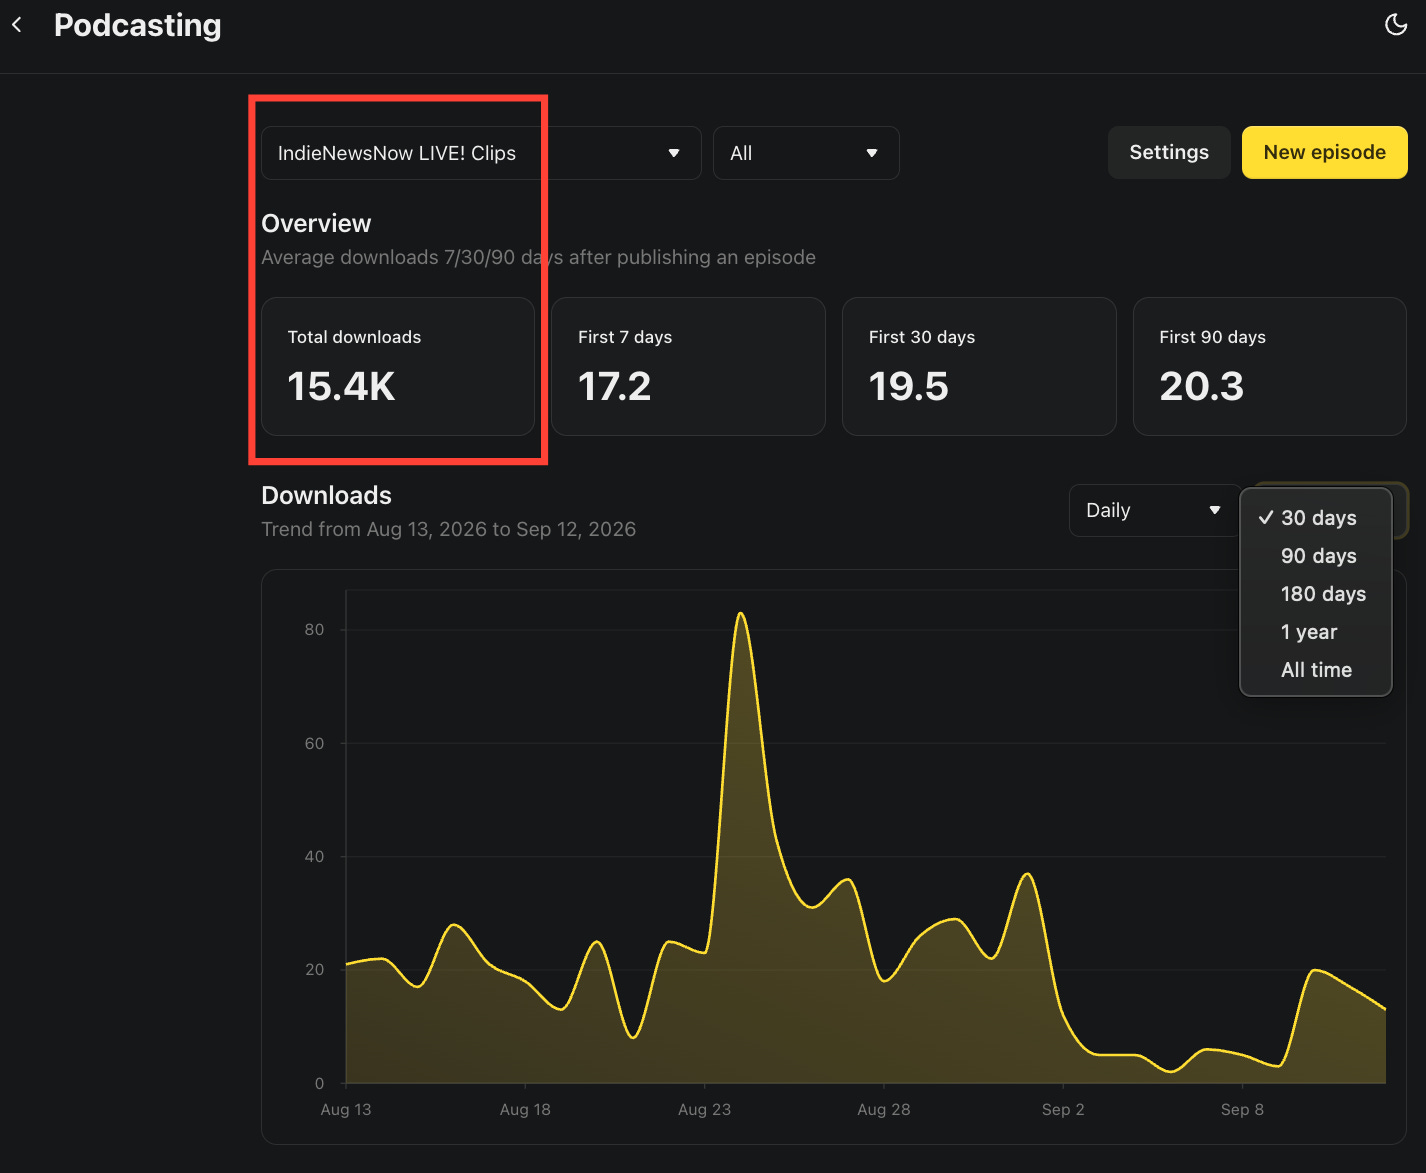
First, we can’t search a specific range of days, only the blocks they make available.
Second, they give no indicator WHICH podcasts were downloaded on a specific day that caused the view count, especially when nothing out of the ordinary was published that day
Third, we aren’t able to see which platforms people used to download a specific episode. On August 24, there were 84 downloads - but WHAT was downloaded? I would love to understand the reason for the spike.
Question 6: Why can’t Substack deliver more actionable podcast analytics? What intelligence can be gained by these numbers?
The Curious Case of the Once-Weekly Podcast With 20+ Downloads Every Day
IndieNewsNow LIVE! Livestream Replays is a podcast I publish every Wednesday morning, after finishing the livestream Tuesday nights. I noticed something strange, which is that, in spite of the podcast only publishing once a week, there seem to be downloads every day.
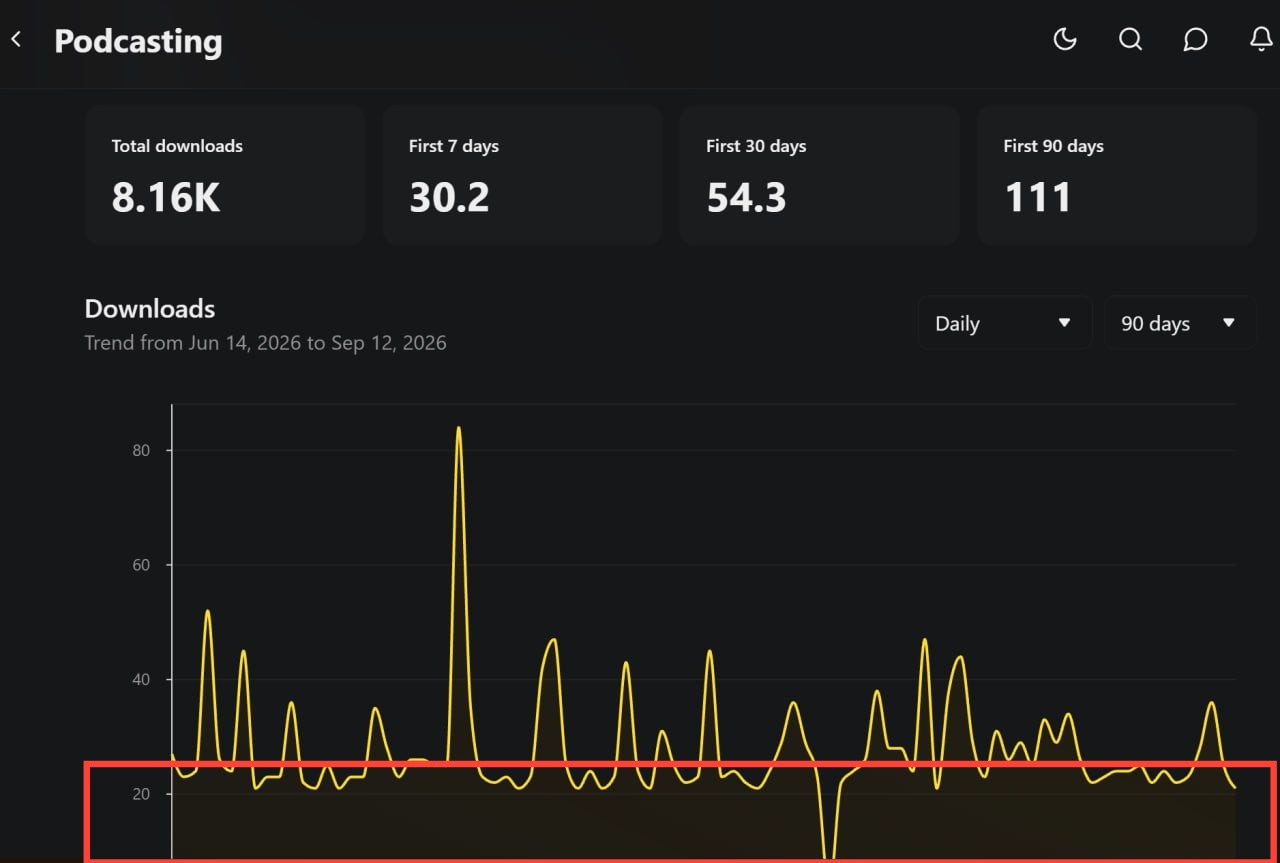
Question 7: What comprises the “daily download count”? How is it calculated?
These are also the video posts that house the livestreams themselves, which are then placed into our draft folder once the livestream is over.
Before making the video post public and emailing the subscribers, I:
add content to the body of the post
add a thumbnail to the video (which we can’t load prior to the livestream)
edit the Post “Settings”
including the post “slug (AKA URL)”
set the Audience to determine who sees & receives the email
update the Podcast Episode Meta Data: square thumbnail, episode # & description, add Tags and a lot more…
Once this is all complete, I schedule the post to publish at 8:30 the following morning. This is all optional, but helps with search visibility, social media & organization.


There are no other publishes to this podcast throughout the week aside from Wednesday mornings. The odd thing is, there are more than 20 downloads EVERY DAY for 89 of the past 90 days.
Yes, I am aware that there is a back-catalog of older episodes going back to November 2025 from this podcast, and 183 episodes of a prior podcast in the history as well, going back to 2021. The podcast was imported from Spotify, which did not seem to generate much download traffic. Are THOSE older episodes still being downloaded and consumed somewhere? Where are the 20+ views coming from? Is this AI scraping my podcast episodes daily?
Question 8: How would I know which older episodes, if any, are being downloaded/listened to on a given day, and when they were downloaded over a timeline? If an older topic is generating interest, wouldn’t it be helpful for Substack to inform the publisher of that?
Where (and When) Can We Learn About What Happened DURING The Livestream?
The statistics of what happened during the livestream are nonexistent. We are never able to see, once the stream is over, the people who visited (even though we can see who joins while it’s live). They don’t show the average time viewed while live anywhere, how many people were watching simultaneously over the duration of the livestream - these are all metrics, which would be helpful, we’re completely in the dark about.
I actually mentioned this in my 4-week evaluation after Substack first introduced livestreaming in May 2025: https://www.indiemediatoday.com/p/livestreaming-to-substack-observations-after-4-weeks-052725-tue?utm_source=publication-search
LIVESTREAMING to Substack: Observations After 4 Weeks

I got really excited last month to learn that we could include Substack into the How Did We Miss That weekly livestream distribution.
This may be more on Substack’s livestream partner, Mux, which is the same technology that powers Instagram’s livestreaming platform. Instagram also provides no insight into what users did while a stream was live. Apparently, Mux DOES offer an analytics solution, likely able to be white-labeled, per this blog post from 5 years ago.
Question 9: How do livestreamers see any viewer behavior, chat engagement, shares or activity WHILE THE STREAM WAS LIVE?
Maybe the higher-ups at Substack can see the ROI to deliver this value-add to the video creators. More actionable info and data about what the livestream viewers are doing after the fact could attract more serious video creators, the big reason for Substack to pursue this.
Thanks for Indulging. How Can You Get Involved?
There are a lot of other idiosyncrasies to deal with when publishing to Substack, and in time they usually address detailed, specific questions like these once they’re raised - to their credit (Thanks to Mills, Zach and team). I haven’t really seen anyone address these questions directly before publicly. One way would be to open a support ticket, asking about more clarity in your publication’s analytics.
If you are experiencing something similar, or want help digging into your numbers to better understand them, or are suspicious about something you see, comment below, share it and tag me, or feel free to reach out privately…
Support independent media, because we need it more than ever.
Help fund the media you want to see! Indie Media Today and Indie News Network operate on a “Value for Value system.”
Everything we do is free to all. We don’t paywall our content, but we do need - and deeply appreciate - your support in order to keep running. One way to do that is with a monthly or annual subscription here.
A $5/mo subscription here or on Ko-Fi.com helps us continue to produce quality content that challenges mainstream corporate funded narratives & amplify independent voices.
Please support your favorite Indie Media creators!
Hi! I’m Indie. “Indie” is not just a person - but a persona and a project representing a fiercely independent, anti-corporate media operation. It’s the voice of a politically unaligned critic and curator who exists outside the traditional Left-Right duopoly. The mission is to seek a trustworthy alternative set of sources apart from the mainstream media (MSM) by championing and amplifying truly independent journalists and perspectives that are corporate-free.
Founder, IndieNews Network (INN)
Publisher, Indie Media Today, IndieNewsNow.com &
Producer, co-host & livestream engineer of multiple shows
Founder, the Indie Media Awards
Discover the news you’re not supposed to see!
Interesting questions. I hadn't really considered any of this, but I'm glad you're digging into it a bit. It's good to understand the metrics rather than just accepting them as pure and gospel.